If you’re running a website or an app, tracking your user experience (UX) metrics is crucial. UX metrics help measure how well your users interact with your product. You can identify problems and improve the user experience by tracking these metrics. This article will discuss the most critical UX metrics and how to track them.
To keep track of your user experience, you must pay close attention to several important metrics. Some of the most common UX metrics include:

- Bounce Rate
This metric measures how often users leave your website without interacting with any content after clicking on a link or searching for something. For example, if someone sees an article that interests them and clicks on it but then closes the tab immediately without reading it, this is a bounce. Tracking this metric can help you quickly identify pages where users are losing interest. If you notice a high bounce rate for a particular page, try revising its design or content to make it more engaging and less frustrating.
- Time On Site
This metric measures how long a user spends on your website or app. If a user spends only a few seconds on your site before leaving, this may be an indication that something is annoying or frustrating about the design, content, or navigation of your product. Conversely, if users spend lots of time on your site and interacting with its various features, it shows that they enjoy using it and find it helpful for their needs. Tracking time on-site is crucial to gauge usability and identify other areas where you can improve your product.
- Conversion Rate
This metric measures how often users complete specific actions while on your website or app. For example, if you have a registration form that you want users to complete, you can track how many users are submitting the form. If only a few people are filling it out, this might signify that your registration process needs to be simplified or clarified. Alternatively, you could analyze which pages have the highest conversion rates and focus on improving those instead of optimizing every page.
- Scroll Depth
This metric measures how far down a page a user scrolls before leaving it. For example, suppose most users scroll less than halfway down a page before leaving it. In that case, this may indicate something about the content above that point that makes it uninteresting or unhelpful for users- perhaps the title isn’t accurate enough to capture their interest. Conversely, if users scroll to the bottom of a page and interact with its content, it indicates that they find it valuable. Tracking scroll depth can help you determine which parts of certain pages need improvement and where you should focus your efforts in revising those pages.
- Time Spent On Page
This metric measures how long a user spends actively interacting with your website or app (as opposed to just bouncing around). Tracking this metric can help you determine whether users find your site’s content valuable. For example, if users spend only a few minutes on a page before leaving it and not returning, this could indicate that the content needs to be more valuable to hold their attention. Alternatively, if they spend several minutes active on each page of your site before moving on, this suggests that they find the content engaging and helpful. You can adjust individual pages by tracking time-on-page metrics so that users get more out of them. You can look here to find out more about the human mind that could help you to attract people to spend more time on the page.
In addition to these five core metrics, there are many other UX metrics that you can track to improve your app or website. Some examples include
- Interaction rate: This metric measures how many interactions your product has had with users. If you have a website or app that has a large number of page views and other interactions, this indicates high engagement. Conversely, if users aren’t interacting with your product significantly (for example, they only view one page before leaving), this might indicate that the content is not engaging enough to hold their attention. This metric can help you understand how active your customers are on your site and find areas where you can improve its usability.
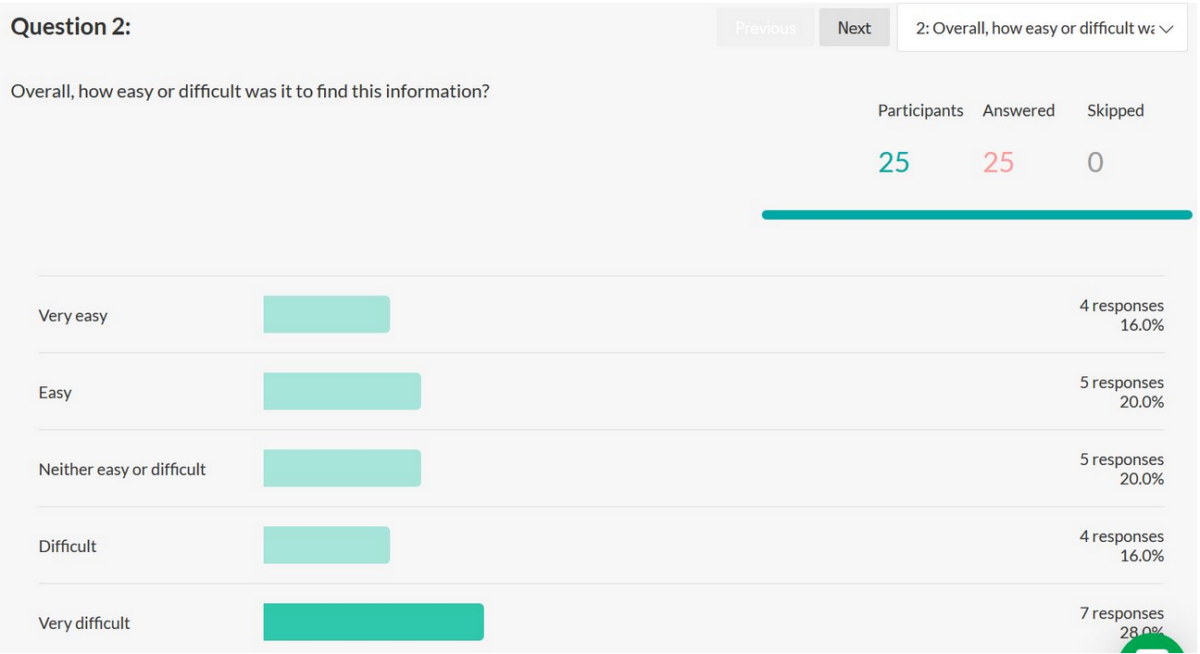
- Customer satisfaction: This metric measures how satisfied users are with your app or site. For example, you might survey your customers and ask them to rate their overall satisfaction on a scale of 1-5, with one being very dissatisfied and five being very satisfied. This metric can help you get a general idea of how people feel about using your product, which may indicate where you should focus your efforts on improving it.
- Net promoter score (NPS): NPS is a customer loyalty metric that companies like Netflix use to measure customer satisfaction. A company rates its customers’ likelihood to recommend the product on a scale of 0-10; if they give it an eight or higher, they are considered promoters of the product; if they give it a six or less, they are considered detractors. The overall NPS is calculated by subtracting the number of detractors from promoters and adding it to the percentage of passive customers. This metric can help you find ways to keep more users happy with your product and motivate them to recommend it to others.
Conclusion
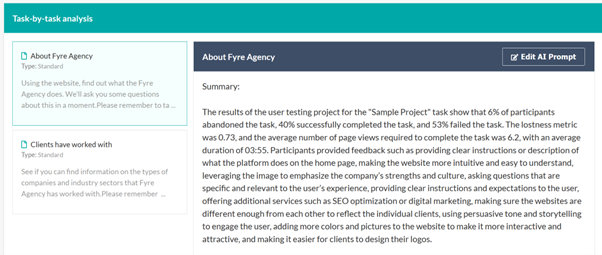
As you can see, you can track a wide range of UX metrics to get information on how users interact with your product. Many of these metrics (including The Lostness Metric in Loop) can be tracked using tools like Google Analytics, which provides detailed insights into user activity and help you improve designs based on data-driven evaluations of your app or site. By tracking these metrics and making changes to improve them, you can ensure that your product is as useful, engaging, and intuitive as possible for all your users.

- A quick guide to UX Metrics - April 11, 2023
- Generative Research: Everything You Ought to Know to Run a Successful Study - October 23, 2022
![]()
![]() Give feedback about this article
Give feedback about this article
Were sorry to hear about that, give us a chance to improve.
Error: Contact form not found.