User experience projects are often ambiguous and challenging, especially in terms of tracking value. Remember the three constraints: cost, scope, and time. Stakeholders are unlikely to consider a project if it costs them much for too little value. Tracking value becomes a bit hard for UX projects for numerous reasons.
*Enter UX benchmarking.*
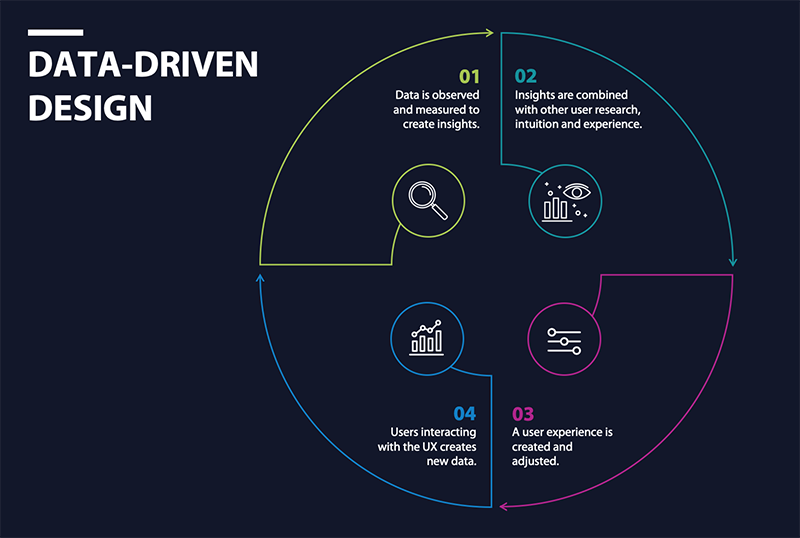
UX benchmarking is the process of evaluating a UX project by using metrics to measure its relative performance against the set standards. Usually, these metrics are collected using quantitative usability testing, analytics, and surveys.
UX benchmarking helps:
- Track the progress of a product or application.
- Compare your UX against a determined goal.
- Demonstrate the value of efforts put into designing better UX.
This article explores the know-how of UX benchmarking and how you can evaluate the overall performance of a product through a summative evaluation.
User Experience Evaluation And Process
What makes a product usable?
“The usability of the product can be found by the extent to which specified users can achieve specific goals by using a product effectively.”
- International Organization for Standardization
It depends on three things:
- Users: For whom the products are designed.
- Goals: What objectives do the products aspire for users’ to complete?
- Context: The use cases that products intend to cater to.
In common terms, usability is “the extent to which a product/service helps users to achieve specific goals.”
But there’s more to it — user satisfaction.
User satisfaction is a game-changing aspect in determining usability. It would be an understatement to say that it’s a crucial aspect of usability.
Measuring The Value Of UX in Your Project in 7 Steps
Keeping the above four aspects in mind, we’ve simplified the UX evaluation process and curated Seven steps to help you track the value of UX in your projects. Let’s get started.
Step 1: Know What Metrics To Track
Before you begin collecting data, outline an overall strategy about what metrics to measure along which timeframes. Include both qualitative and quantitative metrics in the process.
For example, if your services cater to the healthcare industry, you can track metrics to improve your overall medical outcomes such as the motivation of users across the usage of healthcare technology and systems. A simple user survey or feedback can give you a good idea about where their experiences break while using health-tech applications.
Ponder upon the following questions and define the context for your evaluation:
- What metrics best reflect the quality of the user’s experience?
- What exactly are you focused on (website, applications, etc.)?
- Which user groups are you planning to target?
- What tasks or feature outcomes do you want to measure?
Think about the type of UX metrics — qualitative and quantitative.
Qualitative data: Sentiment, loyalty, usability, user satisfaction, and other subjective data
Quantitative data: Measurable data like numbers, ratios, etc.
Here are prominent UX metrics you might want to consider:
1. Net Promoter Score (NPS)
It measures how likely users are to recommend your products or services. A high NPS means that your product solves users’ problems. You can measure the NPS score by asking how satisfied the customers are on a scale of one to ten (one lowest, ten highest).
2. System Usability Scale (SUS)
It is a questionnaire with ten questions to provide UX designers with the overall usability score. This method dates back to the 80s and is considered a great UX metric for measuring usability.
3. Customer Satisfaction Score (CSAT)
CSAT surveys give you a measure of how happy and satisfied your customers are with a particular product, application, upgrade, or feature. It can be of any form — a yes/no question, scale format, etc.
4. Time-on-Task
This particular metric helps determine the average time to complete a specific task. It is an accurate indicator of a product’s efficiency, especially for enterprise products. It doesn’t require any input from the users. Instead, you can use analytics tools to measure and aggregate results.
5. Customer Effort Score (CES)
CES is used to measure how simple it is for a customer to complete a task. You can measure it by asking users about their experience with a scale for their answers.
Other than these, you can also measure error completion, engagement, and conversion rates to identify where your project is lagging and where it works the best.
Step 2: How Would You Measure The Metrics?
Consider the following three aspects while determining a method to measure the metrics.
- Cost of the method
- Skill sets for researchers involved
- Research tools available to you
Do not decide upon a plan that is too expensive and unsustainable for the long term. Remember, UX benchmarking is not a one-time thing — you have to keep repeating again and again.
For instance, for healthcare tech, you can scroll through analytics (of the usability of healthcare applications) or run a survey among the potential users (doctors, caregivers, patients, etc.)
Generally, three research methods work well for UX benchmarking:
1. Quantitative Usability Testing
Participants perform the intended tasks in an application or product, and researchers collect metrics to measure their performance on those tasks.
2. Analytics
You can gather the analytics and reports automatically based on the adoption vs. abandonment rates. You can also make conclusions based on other metrics pertaining to your industry and niche.
3. Survey Data
It is where users answer questions to report their behavior, background, or opinions. Ease-of-use, satisfaction ratings, and net promoter score are all metrics collected in surveys.
Step 3: Establish A Baseline
Once you are done collecting and defining the metrics, it is time to gather your baseline metrics.
Start with considering external factors that might affect your data and establish a plan to tackle that. Remember, you’ll need multiple data sets from your products/services and competitors to make comparisons and identify growth.
For example, patient engagement is quite a huge problem in the healthcare industry. So, you can establish or set a larger goal i.e., to improve the health tech engagement among your users.
Here are examples for each scenario:
Benchmark Based on Competitors
You can benchmark the experience as compared to your competitors. You’ll need data from your product and your competitor’s products.
Industry Benchmark
You can also set up a benchmark based on the current industry standards and try to achieve an above-average score.
Benchmark Based on Stakeholder-determined Goals
You can set up the thresholds defined by the stakeholders and try to maximize your product’s current performance based on this threshold.
Step 4: Redesign The Product
A good design is never done.
Iterations are a regular part of the UX design process. As consumer/user mindset and behavior change, the need for design also changes. Besides, without redesigning, you won’t be able to compare multiple versions of your products.
Step 5: Collect Additional Measurements
After redesigning and launching the updates, you’ll need to go over the measuring part again. Continuous measurement will only benefit you as it will add to the already existing insights and analytics.
For task-based data collection, however, you’ll need to determine the correct time to collect new data. There’s also this aspect that users don’t like frequent changes. So, give them some time to adapt to the updates before measuring it. Once you evaluate the metrics for your upgraded designs, document the potential loopholes and external influences that impact your systems.
Step 6: Interpret The Findings
Once you have at least two data sets or data points, you’ll easily be able to interpret the data. Find out the visible differences in these data sets. Find out if they’re because of loopholes in the system or due to some external factors. Ensure you interpret your results in the right context as per your industry and niche.
For instance, usually, patient engagement problems in health-tech applications arise from clunky user navigation or lack of ease of use. Streamlining that particular pain-pint and making it easy for users to navigate through the systems and improve the engagement rates.
Step 7: Finally – Calculate The ROI
Connect the UX metrics to the organization’s goals and calculate the overall return on investment from those particular metrics. These calculations connect a UX metric to a key performance indicator (KPI) like profit, cost, productivity, efficiency, or customer satisfaction.
Calculating ROI is beneficial and persuasive, yet not practiced widely by UX professionals. Make sure you don’t miss this one.
Final Thoughts
Design and UX largely affect user acquisition, customer engagement, and churn rate. Tracking the value of a UX project is tricky, But the above steps simplify the hassle and make the tasks more doable.
Besides, listening to your existing users and potential users can help you get a good understanding of your current UX standing and the value of UX in your projects. Ensure that you follow the above steps to maximize the business value you derive from the UX projects.
- How To Track The Value Of UX In Your Project - February 28, 2023
![]()
![]() Give feedback about this article
Give feedback about this article
Were sorry to hear about that, give us a chance to improve.
Error: Contact form not found.