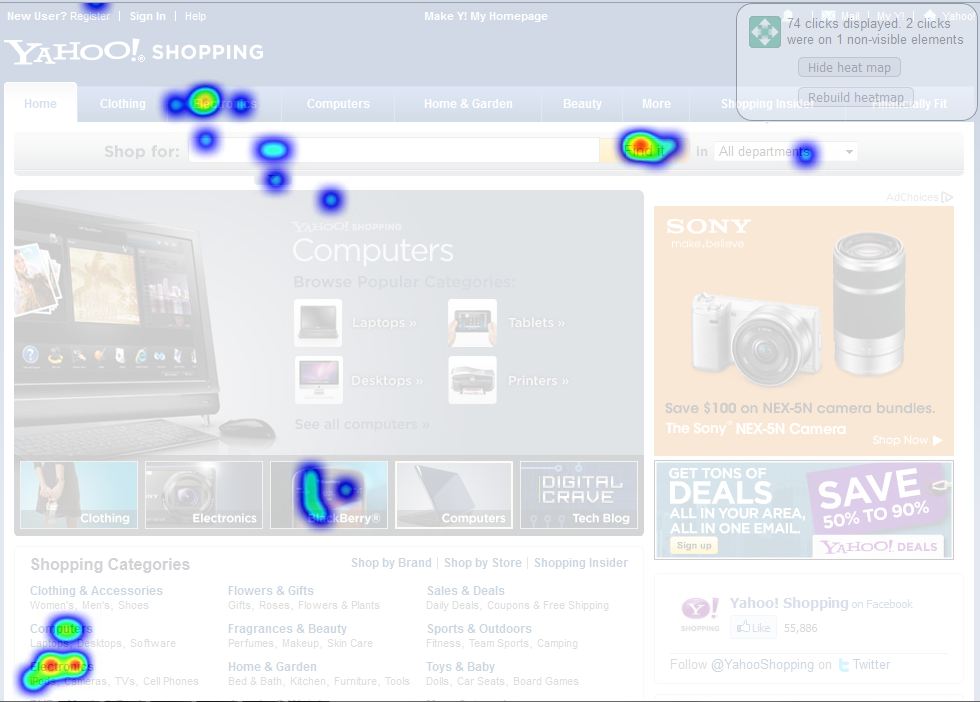
We’re thrilled to announce another new feature for Loop11 – Heat maps.
The heat map reports provide you with a user-friendly graphical representation of where your participants click on your website. The report will let you see task by task everywhere your visitors click anywhere on the page, whether it’s links, images, text or dead space.
The benefits of using heat maps are numerous. The data gathered can offer proof as to where visitors do and do not click, provide useful information when designing and redesigning landing pages, help determine optimal advertisement placement, minimize shopping cart abandonment, maximize conversions of online forms and predict how visitors will use your site in the future.
The heat map reports can be located through your Clickstream Analysis by clicking any of the links circled below.
Oh…and one other important thing…we have been collecting heat map data since April 1 (no joke!). So anyone who launched a project from April 1 onwards will have heat map data in their account.
Happy heat mapping!
 |
![]() Give feedback about this article
Give feedback about this article
Were sorry to hear about that, give us a chance to improve.


