Nothing will ensure your brand’s long-term success like creating a fantastic user experience (UX) for your digital assets. And though this endeavor may sound simple, it is anything but.
It takes a keen eye toward understanding human behavior and adaptability, along with educated observations and analysis to create truly excellent user experiences.
Thankfully, methods and tools are available to help you measure and assess the UX of your products. One such tool is the UX scorecard. A UX scorecard lets you keep track of your progress and ensure that your UX team is continually improving.
But what goes into a UX scorecard? And how do you create one that will be the most effective for your business? In this article, we’ll explore everything you need to know about UX scorecards, starting with what they are and how you can create your own to the tools you’ll need to do so.
So, without further ado, let’s get started!
What is a UX scorecard?
A UX scorecard is a report that allows you to easily see how your website — or any other digital asset—performs against specific metrics over various periods. These reports are typically generated quarterly or yearly based on the nature of the business. They can help you track your progress (or lack thereof) across a variety of key performance indicators, or KPIs.
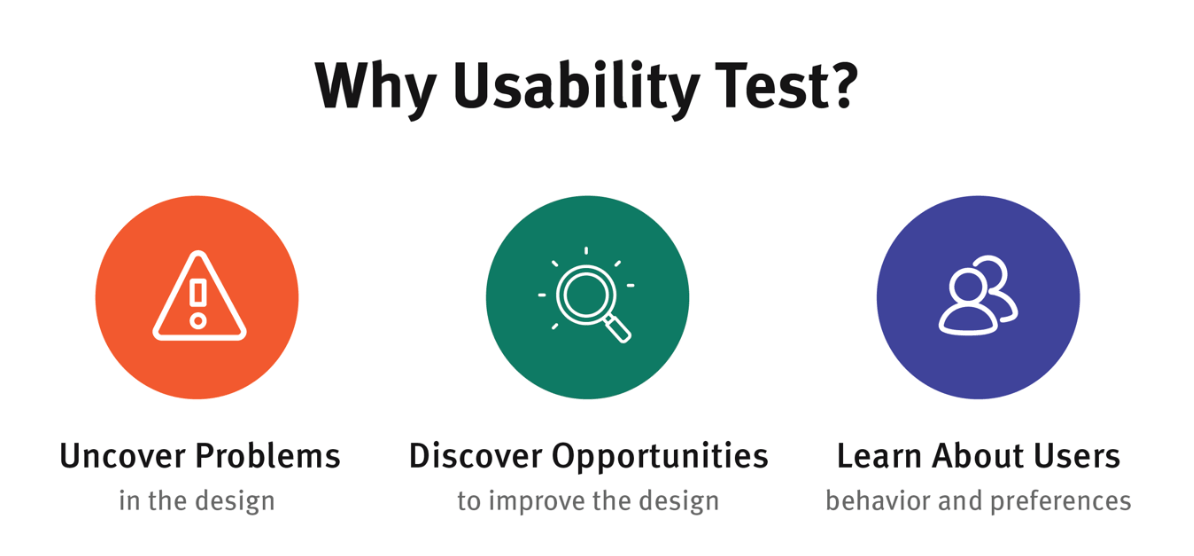
An effective UX scorecard will help you answer the following questions:
- How usable is your product?
- What tasks can users perform with ease, and which ones are more difficult?
- How has your product’s usability changed over time?
- How does your digital asset’s usability compare to that of your competitors?
In short, UX scorecards allow you to quickly visualize the metrics associated with your product’s design and identify areas for improvement.
Steps to create a UX scorecard

Now that we’ve gone over what a UX scorecard is and what it does, let’s take a look at how to make one. While there are various ways to go about making your scorecard, keep these basic steps in mind:
Step #1: Define your goals
The first step to creating an effective UX scorecard is to clearly define the goals and objectives you hope to achieve with it. What are the specific areas of user experience you want to measure and improve?
Some common goals for UX scorecards include:
- Assessing your product’s usability from beginning to end.
- Comparing your product with industry benchmarks or competitors’ products to identify any differences in usability.
- Keeping track of how your product is being used over time.
Step #2: Identify relevant UX metrics
Once you have defined your goals, you need to identify which UX metrics will best help you achieve them.
For instance, a metric such as task success rate or time on task would be most appropriate if you want to assess the end-to-end usability of your product. However, if you intend to compare the usability of your product with that of your competitors, finding metrics that reflect perceived ease of use or user satisfaction might be more helpful.
Tailor your selection of metrics to fit your unique needs. Most UX scorecards use these two types of metrics:
- Task-level metrics. These metrics assess how well users can complete specific tasks on your product. Task success rate, time on task, and error rate are all examples of task-level metrics.
- Study-level metrics. These metrics assess users’ overall satisfaction with and perceptions of your product. Metrics used at the study level include the Standardized User Experience Percentile Rank Questionnaire (SUPR-Q) and the Net Promoter Score (NPS).
Your UX scorecard should include a mix of task-level and study-level metrics to draw meaningful conclusions.
Step #3: Collect data for each metric
Now that you have selected the metrics to include in your UX scorecard, it’s time to start collecting data. Here are some ways to do it:
- User testing. Frequently used to collect data on task-level metrics, user testing involves giving users realistic tasks to complete on your product and then measuring how well they perform. You can identify these fundamental tasks by thinking about what a person needs to do to achieve their goals with the product, or alternatively, by considering the purpose of the product as a whole. For example, if you were testing an e-commerce website, task scenarios might include “find and purchase a product” or “return an item.”
- Analytics tools. If you have access to data from your product’s usage, it will prove an invaluable source of information on both task-level and study-level metrics. Tools like Google Analytics provide insights into how users interact with your product, what tasks they struggle with, and how satisfied they are overall.
- Surveys. Another widely used method for collecting data on study-level metrics is through surveys. You can use surveys to measure users’ satisfaction with your product, their perceptions of its ease of use, and their likelihood to recommend it to others.
Step #4: Create your scoring rubric
The next step in creating your UX scorecard is to decide what level of performance constitutes a “good” score for each metric. For instance, if you’re aiming for a task success rate of 80%, then anything below this would be considered a failure. This will serve as your grading rubric and will help you to interpret the data you’ve collected in a meaningful way. These indicators can help you illustrate and score your UX data:
- Scales. An evaluation on a 1-5 scale or a 1-10 scale, with a higher score indicating better performance.
- Grades. Letter grades, with A’s given for exceptional performance, B’s given for good performance, and so on.
- Colors. A color-coding system, with green indicating good performance, yellow indicating average performance, and red indicating poor performance.
Step #5: Interpret your data and take action
The final step in creating your UX scorecard is to interpret the collected data and use it to inform your decision-making.
This involves taking a close look at each metric and analyzing its shortcomings. You can then take steps to address these issues and improve the overall user experience of your product.
Tools for getting started with UX scorecards
Now that you know how to create a UX scorecard, it’s time to put one together for your product. Here are some useful tools and resources to help you get started:
Tools for participant recruiting
If you’re planning on conducting any sort of UX research, the first step is always to identify your target users and find a way to reach them. This is where user recruiting tools come in handy.
You can find some great platforms like Ethn.io and Userinterviews.com that make finding and connecting with participants easy. These tools also come with a host of pre-screening and automated scheduling features to make the process as smooth and efficient as possible.
Usability testing platforms
Usability testing tools like Loop11 make it easy to test your prototype or website with real users, identify possible frustration points, and gather insights into how people perceive and experience your product. This type of feedback can be invaluable when creating your UX scorecard and making sure that your product is as user-friendly as possible.
Survey platforms
To create an effective UX scorecard, you’ll need to gather data from users on a variety of study-level metrics. Survey platforms like Typeform and SurveyMonkey make it easy to create and distribute surveys to your target audience. These tools also come with a wide range of features to help you analyze your results and glean actionable insights from your data.
QR code generators
Previously, QR codes were primarily employed in restaurants as a way to bring up digital menus. Now, these codes are being used for a variety of purposes including UX research. They provide a compelling means to collect data from users in the wild, as you can use them to trigger survey responses or direct users to specific feedback forms.
The Internet is full of QR code generators that make it easy to create these codes for free and embed them in your app or website. All users have to do is scan the QR code with their smartphone and they’ll be taken directly to your survey. This makes it easy for you to gather information while still providing a high level of user convenience.
Analytics and tracking tools
If you want to create a UX scorecard that accurately reflects user behavior, you need to track and analyze their interactions with your product. To do this effectively, you’ll need to use a tool that provides detailed data on how users interact with your product.
Hotjar is one of the best tools for this purpose, as it provides a wealth of data on how users use your product, what features they use (or don’t use), and how those interactions evolve. This information can be used to pinpoint problem areas, track the efficacy of changes, and much more.
Task management apps
If you’re working with a team to create your UX scorecard, task management apps like Monday or Wrike can be a lifesaver. These tools help you stay on top of who’s responsible for what, set deadlines, and monitor progress.
Plus, by storing all scorecard data in one central place, these tools can also facilitate better communication and collaboration among team members.
Score your UX
UX scorecards are a powerful way to track and communicate the ways that your design changes improve the user experience. And by customizing them to your organization’s goals, you can gain valuable insights into what’s working well and what needs fixing. But creating a UX scorecard is only the first step—you also need to make sure you’re collecting the right data and using it to inform your decision-making. With these steps and tools in hand, you’ll be well on your way to doing just that.

- Why Technical Context Matters in UX Research (And How to Capture It Properly) - May 12, 2026
- How UX Teams Misread Usability Test Results (And What to Do Instead) - March 23, 2026
- How to validate UX decisions before development - February 2, 2026
![]()
![]() Give feedback about this article
Give feedback about this article
Were sorry to hear about that, give us a chance to improve.
Error: Contact form not found.