Features alone cannot make a successful SaaS product.
A well-designed user experience (UX) in SaaS products also plays a critical role in determining the product’s success.
But how do you evaluate UX for its performance?
That’s where UX benchmarking comes in.
This article explores what UX benchmarking is, when to use it, which metrics to track, and which methods to employ to make it a strategic part of your product lifecycle.
What Is UX Benchmarking and Why It Matters in SaaS
UX benchmarking is a unique approach to measuring a product’s usability and user satisfaction by comparing and evaluating defined UX metrics.
Product companies use UX benchmarking to determine how effectively their product meets customer satisfaction as well as how it performs over time or against their competitors.
Why It’s Important:
88% of customers would not return to a SaaS app or a website after having a bad user experience.
Here are the top three reasons why UX benchmarking is important in SaaS:
Tracks User Satisfaction and Ease of Use
UX benchmarking quantifies how happy and satisfied the users are with your products and services.
It also enables teams to collect data-driven insights and see how simple, easy to use, and engaging the UX is with the end-users.
Highlights Areas for Improvement
UX benchmarking can detect which services require improvement and which features aren’t working well and need immediate fixing.
This facilitates teams to focus on exact problems and make efforts that can significantly improve user satisfaction and the product’s performance.
Helps Teams Make Data-Driven Design Decisions
It enables teams to make informed, data-driven decisions by offering solid insights into UX performance based on actual data rather than assumptions.
Additionally, it can validate modifications depending on real user experience and satisfaction metrics.
When Should You Benchmark UX in Your Product Lifecycle?
UX benchmarking is not a one-time process; it is implemented throughout a product lifecycle.
If you’re planning to build a SaaS product, early benchmarking helps identify usability issues before launch, ensuring your design is aligned with user expectations from the start.
Here’s what Vineet Gupta, founder of 2xSaS, has to say:
“UX benchmarking is a continuous process that ensures every product design aligns with user needs. When embedded throughout the lifecycle, it helps teams build experiences that not only satisfy but also retain users.”
Pre-Launch
Conducting UX benchmarking at this point gives product teams critical insights into how users interact and engage with the product.
UX benchmarking at pre-launch can also benefit teams to spot significant usability problems and design issues before the delivery of the final version of the product to the customers.
Post-Launch
Once your product is launched, it is essential to benchmark UX to find out whether your product design and solutions are meeting user demands or not.
Continuously performing usability testing at specific intervals can help teams track how the UX changes over time.
This constant evaluation can also assist in determining whether the improvements in the UX are generating actual benefits or building new resistance and challenges.
Before/After a Redesign or Major Feature Rollout
Before or after launching any new feature or making big changes, it is crucial to put benchmarks in place to see how changes impact the end-users.
This method lets teams determine whether the newest version is better than the old version.
Additionally, it makes design teams more confident because the UX design changes are entirely based on real user feedback and not just guesses.
Key UX Metrics to Track in SaaS Products
User experience metrics for SaaS products help companies understand and evaluate how users engage with the product, in both qualitative and quantitative ways.
Here are the six key UX metrics that teams may utilize to track SaaS products:
System Usability Scale (SUS)
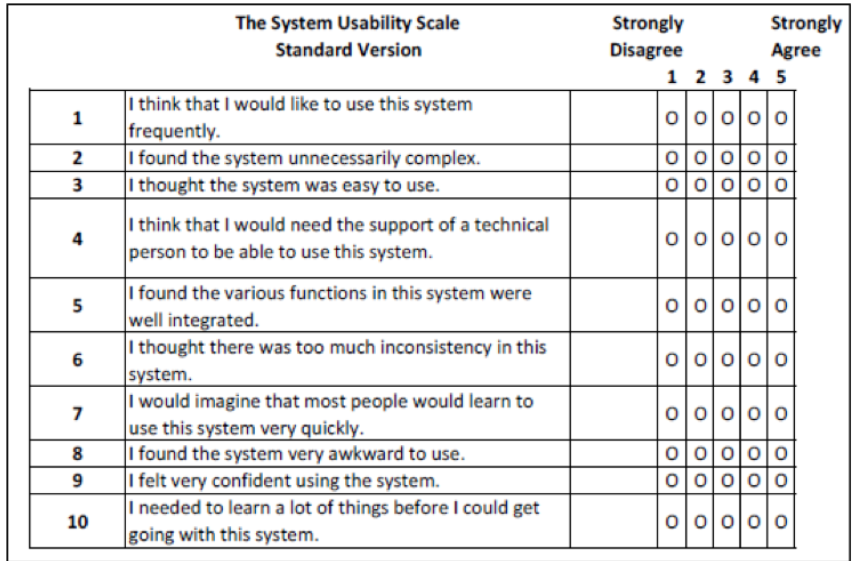
The system usability scale (SUS) metric is a standardized ten-question survey that determines how customers evaluate the SaaS product’s usability.
Users take this survey after completing the testing. It measures each action or item on a five-point Likert scale and generates a usability score out of 100.
SUS is a straightforward and easy-to-measure metric for UX benchmarking.
The following image shows an example of a 10-question survey to measure SUS:
Net Promoter Score (NPS)
The Net Promoter Score (NPS) is an important metric for UX benchmarking.
It shows how happy the customers are and how likely they are to recommend your SaaS products to other people.
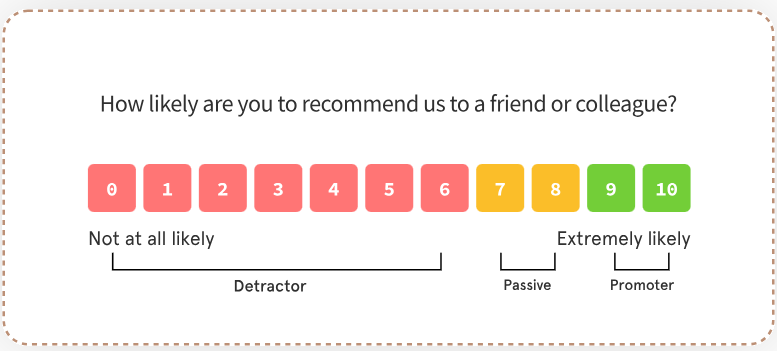
As depicted in the above image, the users can vote for their answers on a scale of 0-10.
The answers are then divided into three categories:
- Promoters (9-10): These are your loyal customers who are most likely to recommend your products to others.
- Passives (7-8): They are neutral but open to switching to other products.
- Detractors (1-6): The users are extremely dissatisfied and are most likely to harm the brand’s reputation.
Task Success Rate
The task success rate (TSR) is simply the percentage of people who finished tasks on your SaaS product’s interface, like buying a plan or filling out the subscription form successfully, without facing any errors.
It is an easy metric to discover the user-friendliness and ease of use of the product or service, and is usually automatically calculated by usability testing tools such as Loop11, UXtweak, or UserTesting after research studies.
By defining a specified target for success, companies can utilize task success rates to identify pain points and improve user experience.
The task success rate is calculated as:

Time on Task
The time on task (ToT) metrics measure how long it takes for a user to complete a specific task. This allows teams to analyze the SaaS product’s usability and efficiency.
High ToT ratings reflect friction areas that may annoy customers and drive them away from completing more actions.
Businesses that track ToT can simplify critical tasks, minimize user effort, and increase customer satisfaction and product performance.
Here’s the formula to calculate time on task:

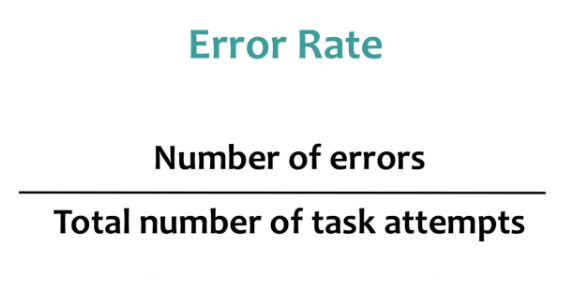
Error Rate
The error rate (ER) calculates how often users make errors while performing any task or activity on the SaaS product.
This allows product teams to discover usability issues with the interface.
Measuring ER over time across designs enables teams to measure the impact of UX changes and benchmark the performance.
A high ER reflects the need for design modifications, improved training, or more detailed documentation, assisting teams to prioritize development efforts.
Below is the formula to calculate the error rate:
User Satisfaction Scores
The user satisfaction score (USS) tells teams how satisfied people are with your product or service.
Most importantly, it shows whether the product meets user expectations or not.
A good USS shows excellent user approval and improves customer retention and brand reputation.
Effectively tracking this metric can help companies enhance user experience and remain competitive by addressing issues in the early stages.
Here’s how you can determine the user satisfaction score:
![]()
How to Conduct UX Benchmarking (Step-by-Step)
- Choose What Part of the Product to Evaluate
Start by selecting and analyzing a single aspect of the product, such as login, onboarding, feature identification, and payment process.
Focus on high-impact user processes in which UX significantly impacts critical KPIs like customer conversion or retention.
One-by-one evaluation of product user experience aspects may allow you to obtain valuable information and make changes more efficiently.
- Select the Right Metrics and Tools
Pick the right metrics and tools based on what you desire to evaluate.
Choose SUS or NPS to measure usability and satisfaction, or select time on task to benchmark time for UX.
You can also use conversion rate and renewal rate to measure user adoption and retention. Similarly, utilize the error rate and success rate to find out task efficiency.
Whichever metrics you select, just remember to select those that show efficient results for the long run, as you might have to track the metrics repeatedly at regular intervals.
- Run Usability Tests or Surveys
Usability testing and surveys are two of the most effective UX benchmarking methods.
The usability tests involve having actual users carry out critical activities while the team observes and measures their user experience on metrics like task success rate, satisfaction, or time on task.
Surveys, on the other hand, capture user-reported data based on experience and ease of use, based on metrics like satisfaction ratings and NPS.
- Analyze and Compare Results Over Time
At this step, you can analyze the collected data to identify patterns and compare results over time.
Continuously monitor improvements, detect regressions, and notice unexpected trends in user behavior and satisfaction levels.
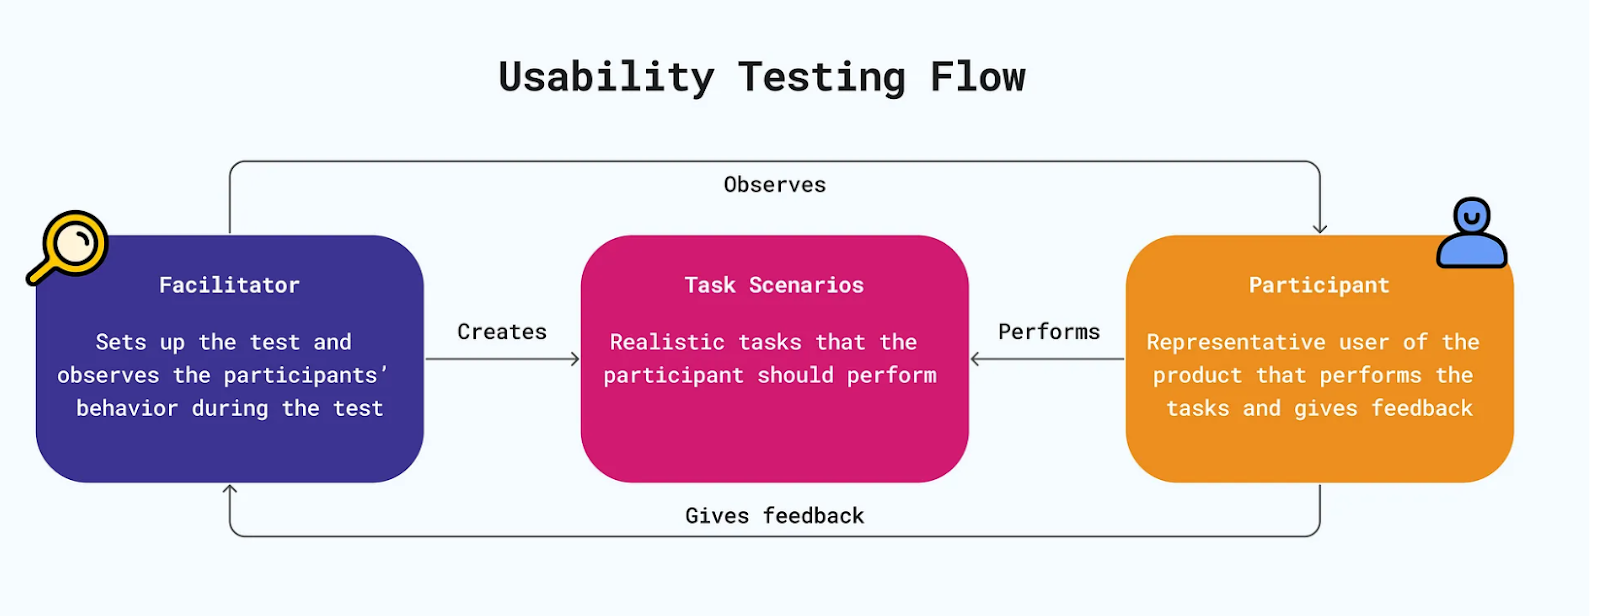
Example: Sample Usability Test Flow
Here’s a visual representation of the usability test flow:
Tools and Methods You Can Use
You can use different tools and methods to perform UX benchmarking:
Remote Usability Testing
To conduct usability testing remotely, you can leverage a tool like Loop11, which empowers organizations to source test users, set tasks, and get performance data in real-time.
Loop11 additionally facilitates teams to assess usability metrics in moderated and unmoderated conditions.
It is capable of tracking all the primary usability testing variables, along with the time on task, task success rate, and user satisfaction to obtain qualitative and quantitative data.
This method offers rapid and reliable insights into users’ engagement and interaction with your products in the actual environment.
Surveys
Use tools like Google Forms and Typeform to design unique surveys that include UX-specific metrics for tracking metrics like SUS and NPC.
Surveys are a simple and cost-effective way to gain user feedback quickly and measure how customers perceive your product.
Heatmaps and Session Recordings
Hotjar and Smartlook heatmaps and session recordings let teams visualize how real users engage with their products, such as in the form of clicks, scrolls, and drop-off places.
After analyzing these data-driven insights, teams can figure out where users are facing trouble or losing interest, and thus find areas of improvement.
Analytics Tools
With tools like Mixpanel and Amplitude, product teams can easily keep tabs on user activities, time on each task, and features they use the most.
Also, this data can be divided by user types, e.g., newly registered users, free users, or paid customers, to understand how each group interacts with your product.
Here’s a pro tip:
For an overall understanding of user experience, integrate qualitative figures with quantitative values.
Use numbers to find out which tasks encourage users to make further interaction with the product and which confuse them to stop and leave immediately.
Then, combine these numbers with users’ opinions in survey results, feedback, and product reviews, and understand the actual picture of user behavior patterns for UX benchmarking.
Benchmarks vs. Business Metrics: What’s the Link?
Business metrics give key performance indicators like conversion rates or customer retention, whereas a benchmark is simply a comparison point between two values.
Organizations can employ different kinds of data (metrics and benchmarks) to set goals, which enable them to measure the results of their process improvement initiatives.
Comparing data with industry averages, competitors, or past performance enables teams to perform effective benchmarking and determine if performance at a point in time is good or if there is a potential for further improvement.
How Improved UX Leads to:
Better Onboarding and Retention
An easy user onboarding process guarantees that users quickly understand a product’s value, thus raising the retention and engagement rates.
Higher Trial-to-Paid Conversion Rates
An interface that is interactive, engaging, and easy to use allows end users to effortlessly complete tasks, which in turn, promotes further conversion from free to paid premium plans.
Reduced Support Tickets
By enhancing usability flow and error handling, you reduce ambiguity and eliminate common user issues.
This leads to fewer support requests and allows teams to focus on more critical problems.
Making Benchmarking a Continuous Practice
Performing UX benchmarking requires continuous efforts. Here’s how you can gain maximum results:
Set a Schedule
Set up a regular schedule for UX benchmarking, like every quarter or after a major product launch.
Involve Cross-Functional Teams
Make sure you get input from and collaborate with different teams. Get thoughts and opinions from product designers, managers, coders, marketers, and support staff to gain diverse ideas for enhanced UX benchmark data.
Document and Share Findings Across the Company
Consolidate UX benchmarking results in a report or dashboard, and provide the key insights to the team regularly, via standups, calls, video, or Slack in a transparent manner across the company.
UX Benchmarking Is a Must for SaaS Products
UX benchmarking isn’t just about making designs better. It’s about giving end-users a better user experience that achieves successful results.
If you regularly monitor key metrics like system usability scale, error rate, time on task, or net promoter score, you can make smarter design choices, lower churn rate, and scale your SaaS product more quickly.
Looking for a usability testing platform? Explore Loop11. It’s built with robust capabilities for user testing and product optimization for informed design decisions.
Start your free trial now.

- Testing Conversational Flows: What UX Teams Should Look For - April 27, 2026
- Everything You Need to Know About Benchmarking UX in SaaS Products - September 30, 2025
- Surveys vs. Usability Tests: Choosing the Right UX Research Tool - February 18, 2025
![]()
![]() Give feedback about this article
Give feedback about this article
Were sorry to hear about that, give us a chance to improve.
Error: Contact form not found.